Amber Monitor
This is an ongoing experimental development and needs refinement. The core idea is straightforward: if we can build good observability and monitoring tools for Amber, we can reuse the same patterns for any app that Amber develops. A monitoring system that understands how to watch one platform can be taught to watch others. The long-term goal is a reusable observability kit that ships alongside every project Amber creates.
The Problem with “Is It Up?”
Running an agent platform across three environments (local, staging, production) means constantly checking whether things are healthy. Is the API responding? How’s the heap? Did the TLS cert quietly expire? Is Cloudflare having a moment?
Opening three terminal tabs, curling endpoints, and reading docker stats is nobody’s idea of a good time. Amber Monitor replaces all of that with a single dashboard that checks everything every five minutes and tells you what matters.
What It Actually Does
Amber Monitor is a lightweight, local-only DevOps tool that runs on your Mac via launchd. It has three layers: a collector that gathers raw metrics, an AI analyst that triages the results, and a React dashboard that displays everything in one place.
The collector runs every five minutes. It checks both staging and production environments for frontend availability, API health, system memory, CPU pressure, TLS certificate expiry, and DNS resolution. It also monitors the local Mac itself: RAM and swap usage, Docker memory allocation, container counts, orphaned Vite dev servers, and stale esbuild processes. All data is written as newline-delimited JSON, so it’s trivially parseable and never locks you into a proprietary format.
The analyst runs every 15 minutes (or immediately on alert). It invokes Claude to read the recent check data and produce a structured severity assessment. Instead of you reading numbers and deciding “is 87% heap usage okay?”, the analyst considers context, recent trends, and threshold proximity to give a plain-English verdict. When things go wrong, it posts to Slack with severity-based notifications.
The Dashboard
The dashboard is a Vite + React + Tailwind app running locally on port 5177, backed by an Express server on port 4500 that reads the JSONL log files.
Health Tab
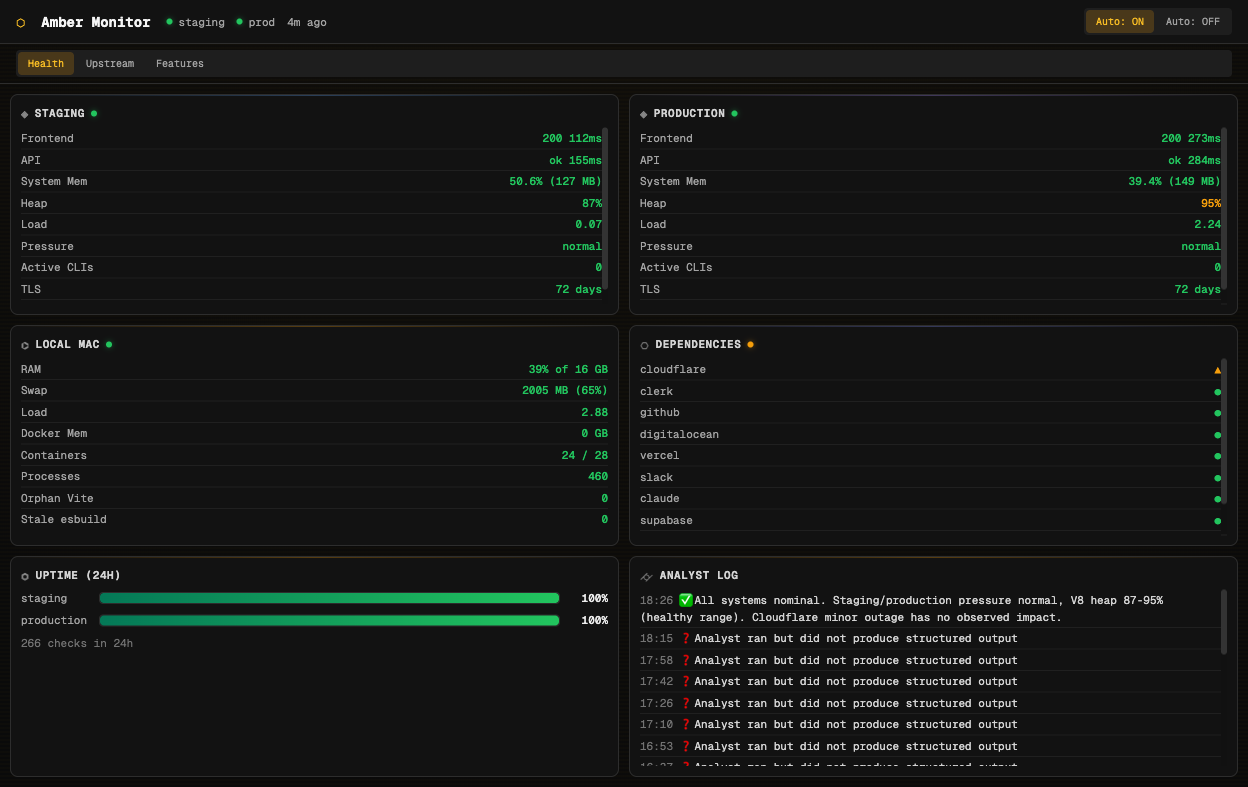
The Health tab is the default view. It shows real-time status for staging and production side by side: HTTP status codes, API response times, system memory, V8 heap usage, CPU load, and TLS certificate expiry. Below those, a Local Mac card tracks your development machine’s resources. A Dependencies card monitors the status pages of every upstream service the platform relies on: Cloudflare, Clerk, GitHub, DigitalOcean, Vercel, Slack, Claude, Supabase, Convex, and OpenRouter.
At the bottom, a 24-hour uptime bar shows percentage availability for each environment, and the Analyst Log displays the AI’s most recent assessments.
The header shows environment status at a glance with coloured indicators, the data freshness (“4m ago”), and auto-refresh controls.
Upstream Tab
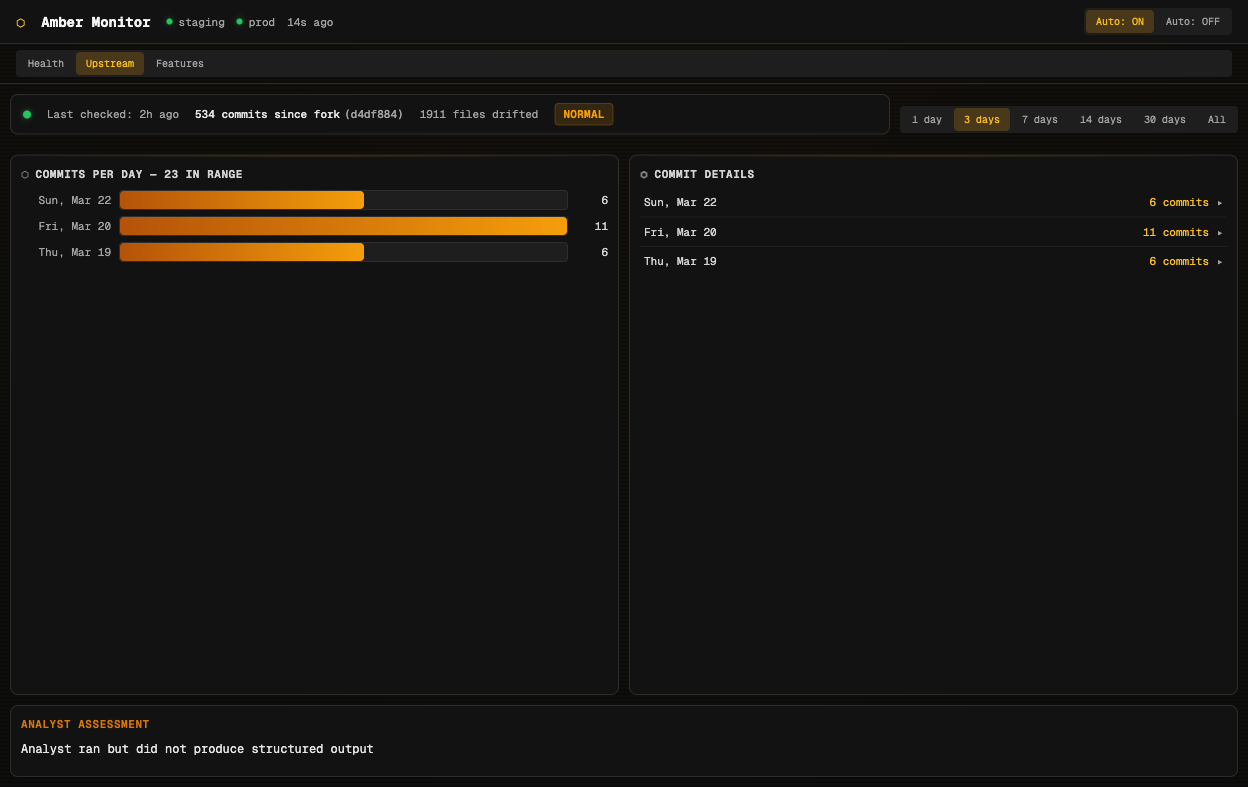
Agent Beehave is a fork. The upstream codebase continues to evolve, and knowing how far the fork has drifted is essential for deciding when to sync. The Upstream tab tracks this automatically.
A heartbeat collector runs every six hours, comparing the fork against its upstream origin. The summary banner shows total commits since fork (534 at the time of writing), files that have drifted (1,911), and overall divergence health. A bar chart shows commit activity per day with expandable details, and the analyst provides periodic triage assessments of whether the drift is manageable or needs attention.
Time range filters (1 day through to all history) let you zoom in on recent activity or see the full picture.
Features Tab
The Features tab is the most distinctive part of Amber Monitor. It visualises all 191 features in the platform, showing where each one came from, how it was implemented, and how it relates to other features. Four visualisation modes give different perspectives on the same data.
Grid View
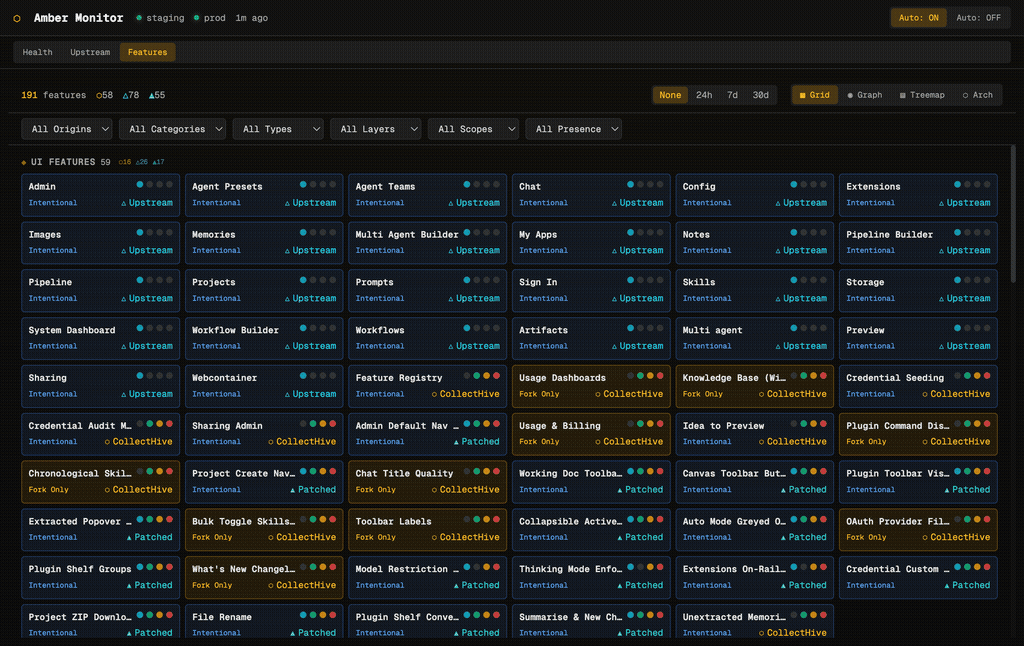
Each feature is a “brick” showing its name, classification (Intentional, Fork Only, Must Differ), origin (Upstream, CollectHive, Patched), and presence indicators (coloured dots for which files/layers the feature touches). Features are grouped by category: UI Features, Backend, Infrastructure, and so on. Filter dropdowns let you slice by origin, category, type, layer, scope, or presence.
Graph View
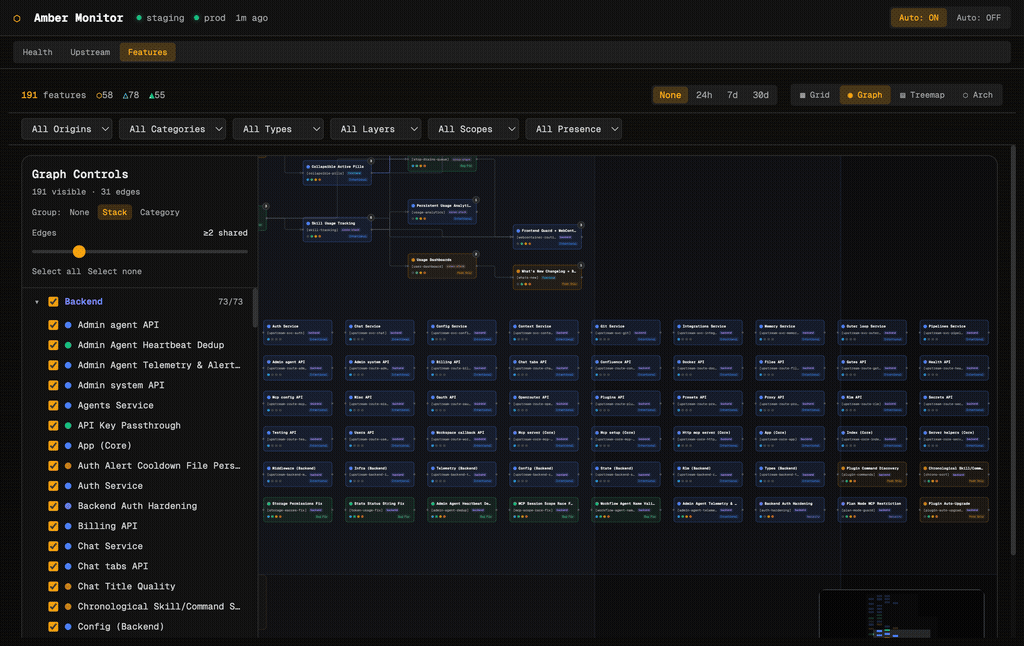
The graph view plots features as nodes with edges showing shared files between them. A left-hand control panel lets you group by stack layer, filter the minimum shared-edge threshold, and toggle individual features on and off. This is useful for understanding which features are entangled and which are cleanly isolated.
Treemap View
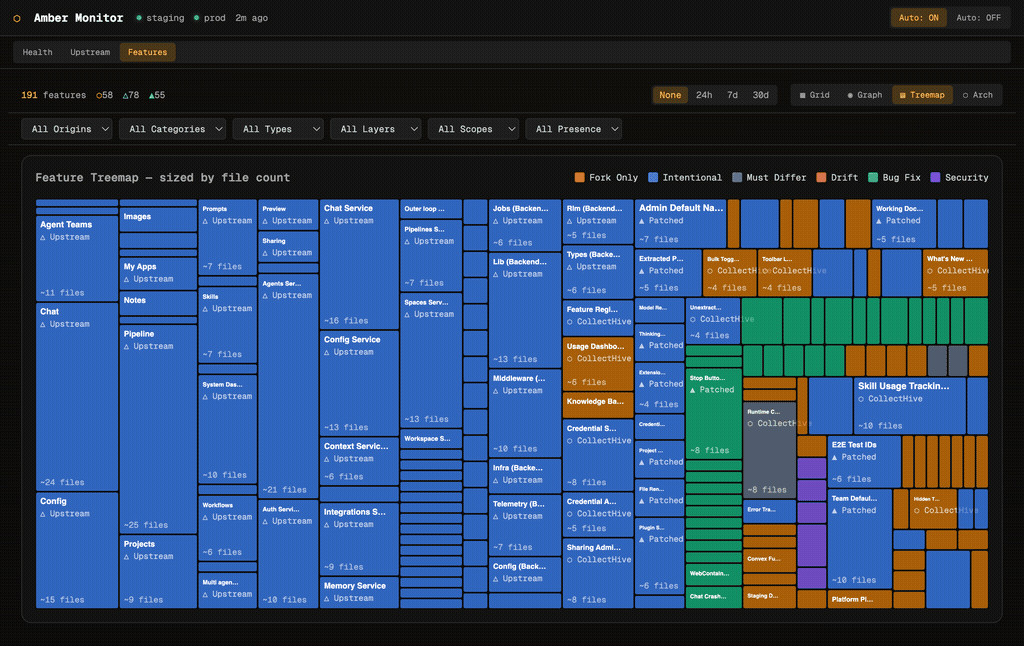
The treemap sizes each feature by file count, giving an instant sense of relative complexity. Large upstream features like Chat Service and Agents Service dominate the layout, while smaller fork-only features like Toolbar Labels and Chat Title Quality are visible but proportionally smaller. Colour coding distinguishes origin: blue for upstream, orange for fork-only, teal for patched.
Architecture View
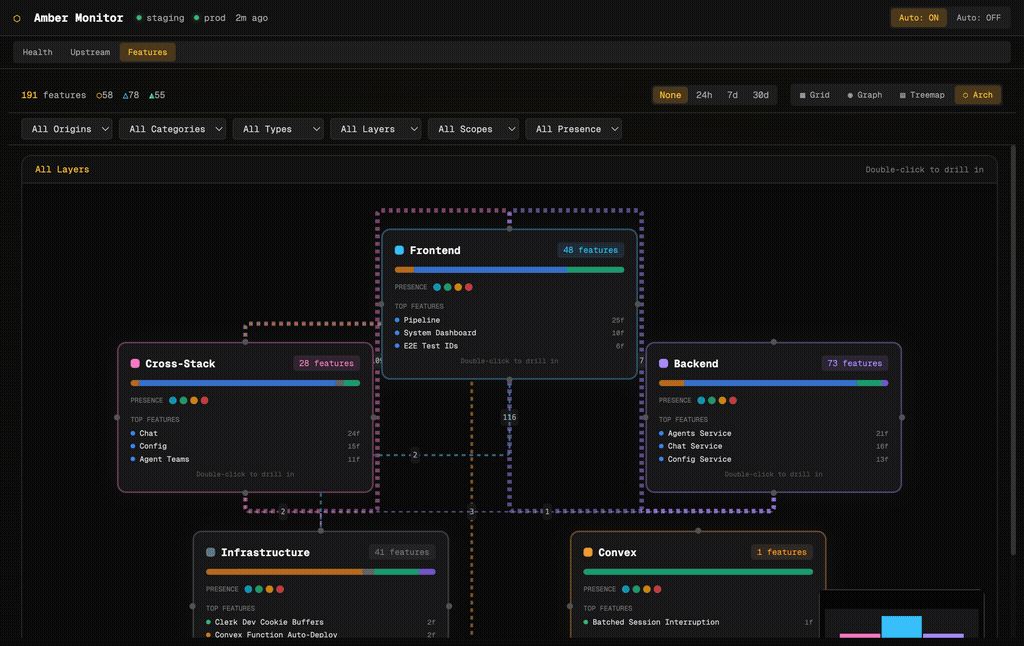
The architecture view groups features by stack layer: Frontend, Backend, Cross-Stack, Infrastructure, and Convex. Each layer card shows feature count, an origin-distribution bar, presence indicators, and the top features by file count. Edges between layers show cross-layer dependencies. Double-click any layer to drill into its features.
How It’s Built
The whole system is deliberately simple. No database, no hosted service, no cloud dependency. The collector is a bash script using curl, openssl, dig, and jq. The analyst calls the Claude CLI. The dashboard reads flat JSONL files. Everything runs on your Mac via three launchd agents.
This is intentional. A monitoring system that depends on the same infrastructure it monitors is not a monitoring system. By running locally and storing data as flat files, Amber Monitor keeps working even when everything it’s watching is broken.
Technical Detail — Component Architecture
| Component | Technology | Schedule | Port |
|---|---|---|---|
| Collector | Bash + curl/openssl/dig/jq | Every 5 minutes | n/a |
| Upstream Collector | Bash + git | Every 6 hours | n/a |
| Analyst | Claude CLI | Every 15 minutes (or on alert) | n/a |
| Dashboard Backend | Express.js | Always running | 4500 |
| Dashboard Frontend | Vite + React + Tailwind | Always running | 5177 |
All data lives in logs/ as newline-delimited JSON files. The Express server reads these directly, no indexing or preprocessing needed. Alert thresholds are configurable in collector/thresholds.env.
Slack notifications fire on non-healthy analyst findings, with severity-based emoji to make scanning quick.
What It Doesn’t Do
Amber Monitor is read-only. It watches, analyses, and reports, but it never takes corrective action. It won’t restart containers, roll back deployments, or modify configuration. That’s by design: the value is in surfacing information quickly and accurately, not in autonomous remediation that could compound problems.
It also doesn’t replace application-level observability (Sentry, runtime logs, Convex dashboards). Amber Monitor sits above those tools, giving you a single pane of glass for “is the platform healthy right now?” without needing to check five different services.