Analysing My Claude Code CLI Sessions
The plan is to bring these kinds of assessment frameworks into Agent Amber so that members can get the same visibility into their own sessions — understanding what’s working, what’s causing friction, and how to improve over time. This is the first step: running the analysis on my own usage to figure out what’s worth measuring.
I’ve been building with Claude Code daily since early February 2026. After a few months and somewhere north of 300 sessions, I started wondering what was actually happening in those conversations — not the output, but the shape of the work. Where does time get lost? What patterns actually move things forward? What keeps tripping me up?
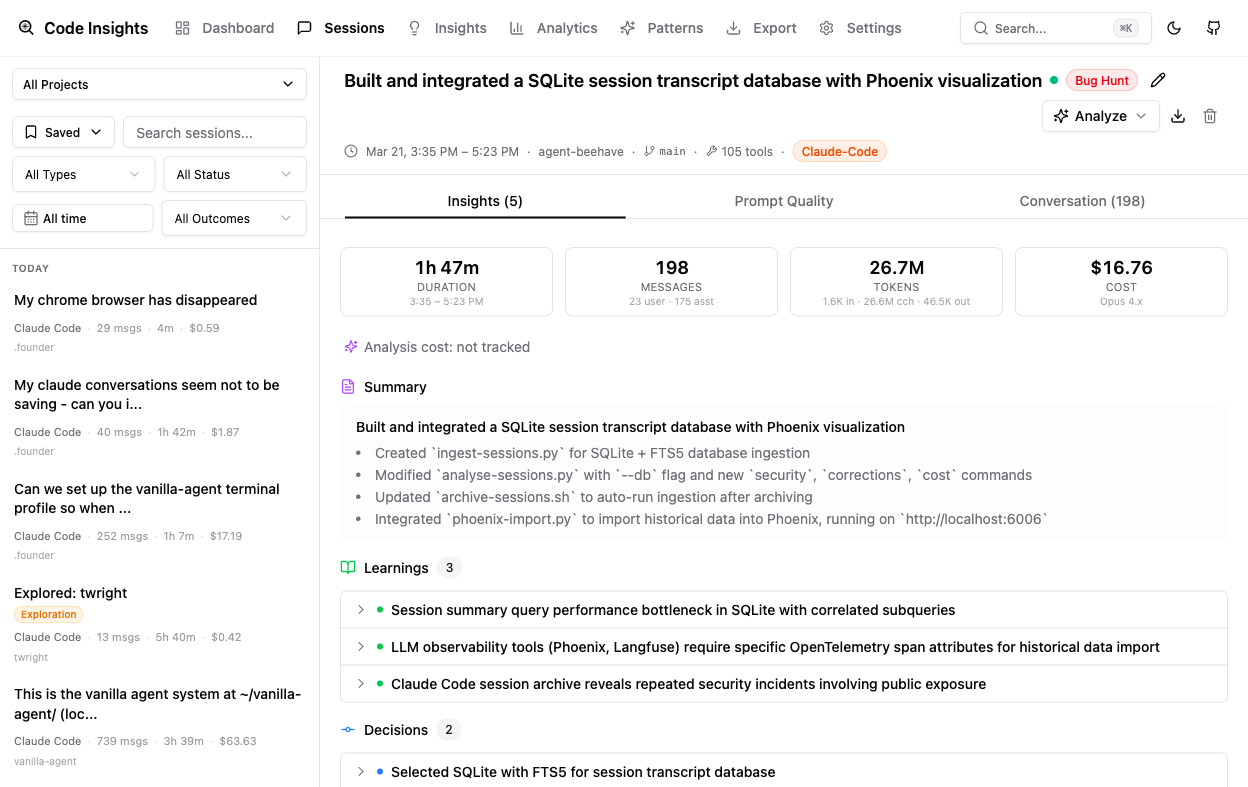
I found code-insights, an open-source tool that analyses Claude Code session JSONL files locally. It parses the session logs already sitting on your machine, extracts learnings, decisions, friction points, and effective patterns, and presents them in a usable interface. Everything stays local — no data leaves your machine, apart from the analysis step which sends session content to OpenRouter for LLM-powered insight extraction. Before running it, I verified that myself: inspected the source, checked network activity, and confirmed the tool isn’t sending data anywhere else. The raw session files and the resulting SQLite database stay on your machine. I ran it across my sessions and this is a snapshot of what I’ve found so far. It’s an experiment in progress, not a tidy conclusion.
The Numbers
| Metric | Value |
|---|---|
| Sessions analysed | 328 |
| Insights extracted | 1,221 (643 learnings, 382 decisions) |
| High-satisfaction sessions | 78% |
| Sessions with course corrections | 90% (177 of 196 analysed) |
| Top workflow | debug-fix-verify (79 sessions) |
| Top project | agent-beehave (218 sessions) |
It’s worth noting that the overwhelming majority of these sessions have been focused on building the agent system itself — Agent Amber and the infrastructure around it. That’s the core of what I’m doing with Claude Code day to day: building, debugging, and deploying the platform.
The number that stood out immediately was the 90% course correction rate. Almost every session involves changing direction at least once — abandoning an initial approach, revising an assumption, or discovering that the problem was different from how it was first framed. That’s not necessarily a sign of poor planning. It might just be what working with AI on real problems looks like. But it’s worth understanding rather than ignoring.
What the Analysis Found
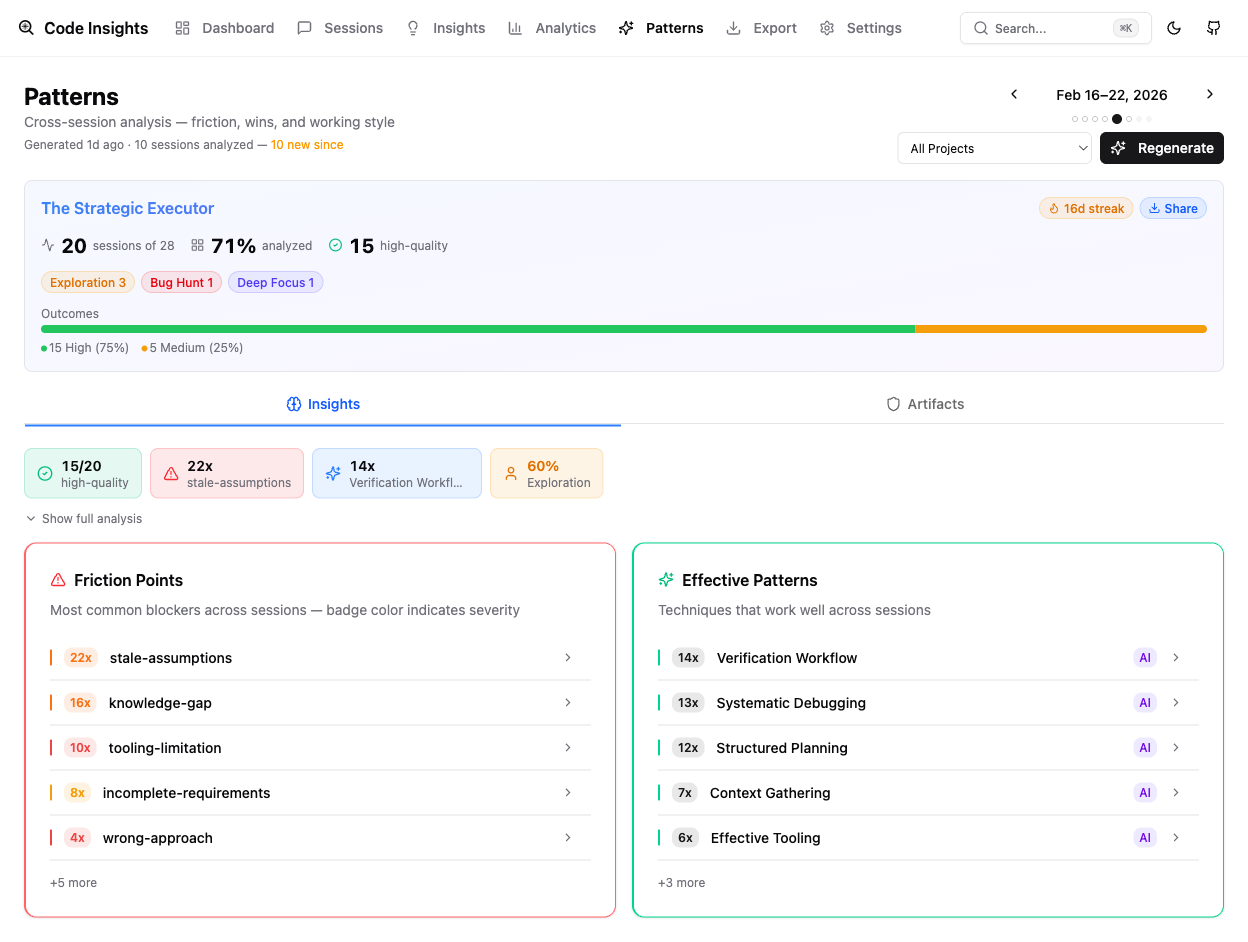
Friction Points
The single largest friction category — by a significant margin — is stale assumptions, appearing in 212 sessions. This is the pattern where something that used to be true no longer is: a hardcoded path that fails on ARM64, an OAuth token that expired, an assumption that a project directory exists when only metadata does, production traffic still routing to a Mac instead of the expected Digital Ocean server. Systems evolve faster than mental models, and these mismatches generate a disproportionate amount of rework.
Knowledge gaps account for 192 occurrences. These are distinct from stale assumptions — not things that changed, but things I never knew in the first place. Hitting an unfamiliar edge case in a tool, not understanding why a Docker bind mount behaves differently inside versus outside a container, or misreading how a framework handles a specific scenario. The fix is usually documentation or experimentation, but the cost is time lost mid-session.
Tooling limitations appeared 109 times: hitting walls with Docker bind mount constraints, git submodule edge cases, or context window compaction dropping implementation details mid-session at exactly the wrong moment.
Wrong approach showed up 68 times — taking a complex path when a simpler one existed. The clearest example in my logs: attempting UI automation through Playwright when a straightforward git patch would have solved the problem in a fraction of the time.
Effective Patterns
The two most common effective patterns were systematic debugging (125 sessions) and context gathering (123 sessions). Both involve doing investigative work before acting — understanding what’s actually happening before deciding what to do about it. That’s probably not surprising, but it’s useful to see it confirmed in the data rather than just assumed.
Structured planning appeared in 99 sessions: breaking work into explicit steps before starting, rather than improvising. And verification workflows in 80 sessions — validating each step before moving on, rather than running through an entire implementation and checking at the end.
Changes I’ve Made
The stale assumptions pattern was direct enough to act on immediately. I updated my CLAUDE.md instructions to explicitly document deprecated systems, archived paths, and current infrastructure state — the things that change often enough to catch me out. If the information is in the context at the start of a session, the assumption can’t go stale.
I also added verification checkpoints to a few workflows where context loss mid-session was causing rework. Rather than running long sequences and checking at the end, the pattern now is shorter loops with validation steps built in. And I’ve shifted my default approach away from complex automation when simpler direct methods are available — the Playwright example above is now a prompt for me to ask whether there’s a more direct path before committing to an approach.
Going forward, I’m reviewing code-insights output weekly, rather than treating it as a one-time analysis. Patterns that show up once might be noise. Patterns that keep appearing after you’ve tried to address them are telling you something.
What’s Next
The biggest shift is structural. I’m moving more of my development work into a local version of the agent system — Vanilla — so I can focus on improving how that system optimises its own workflows. Instead of building Amber directly from the CLI, Vanilla sits in between: a local environment where I can observe, test, and iterate on how the agent system works before pushing changes out. That gives me a tighter feedback loop and a better place to apply what this analysis is surfacing.
Beyond that, I’m starting weekly pattern synthesis — looking at whether the friction categories are shifting, whether the changes I’ve made are actually reducing the stale-assumption rate, or whether new patterns are emerging.
I’m also interested in expanding the analysis to other team members’ sessions with their consent, to understand whether the patterns I’m seeing are personal to how I work or something more general. And I’m exploring whether the generated patterns and rules could feed back into CLAUDE.md automatically — closing the loop between what the analysis finds and what the AI knows going into the next session.
The deeper question — whether prompt quality correlates meaningfully with session outcomes — is something I want to look at once I have a few more months of data. For now, the patterns view is already useful enough to make it worth running.